Ends Today: Save up to 95% on the Time Travel Mega Bundle!

Micro Benchmark - Profiler Tool for Blueprint and Code Performance Timing

Have you ever looked at a few lines of your code or a block of Blueprint nodes and asked yourself: "I wonder how long this block takes?" Well, wonder no more -- measure it!

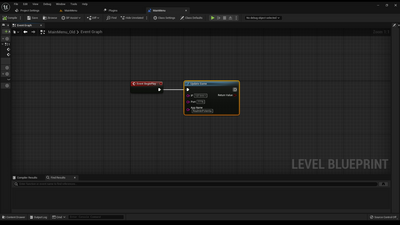
With MicroBenchmark, call Tic (in Blueprints or C++) before the block in question and Toc directly after. You instantly get a timing profile of the execution time with nanosecond accuracy. Optimize your code by comparing different implementations, find out if native C++ code is faster compared to pure Blueprints, identify bottlenecks and get a better understanding of your code's performance.

Tutorial & Documentation | Support Forum


Changelog:

  • 2022-12-11: UE 5.1 compatibility update
  • 2022-07-10: Fixed bug in seconds display

Technical Details

Features:

  •  Easy measuring of C++ or Blueprint execution time
  •  Supports averaging results over many calls to suppress noise / outliers
  •  Plug and Play, with no setup
  • Comprehensive documentation
  • All C++ code is fully documented and source-open

Code Modules:

  •  MicroBenchmarkTimer (Runtime)

Number of Blueprints: 1

Number of C++ Classes: 3

Supported Development Platforms: Windows, Mac, Linux

Documentation: https://maschere.github.io/asset-documentation/micro-benchmark

Example Project: Demo Blueprint actor included in plugin content folder.

Important/Additional Notes: The plugin automatically disables any performance measurement code in Shipping builds.

9.67 
Platforms Windows 64-bit, Linux, MacOS, Android, iOS
UE Versions 4.26 - 4.27, 5.0 - 5.1
Tags EASY SETUP, PERFORMANCE, TIMER, MODULAR, PLUG N PLAY, BLUEPRINTS, TIMING, PROFILER, BENCHMARK, MEASUREMENT, FPS, CPU, CPP, EASY TO USE, PROFILING
Release date 23.04.2022

Similar products

Image
Sign In
Image
Sign Up
Image
Recovery